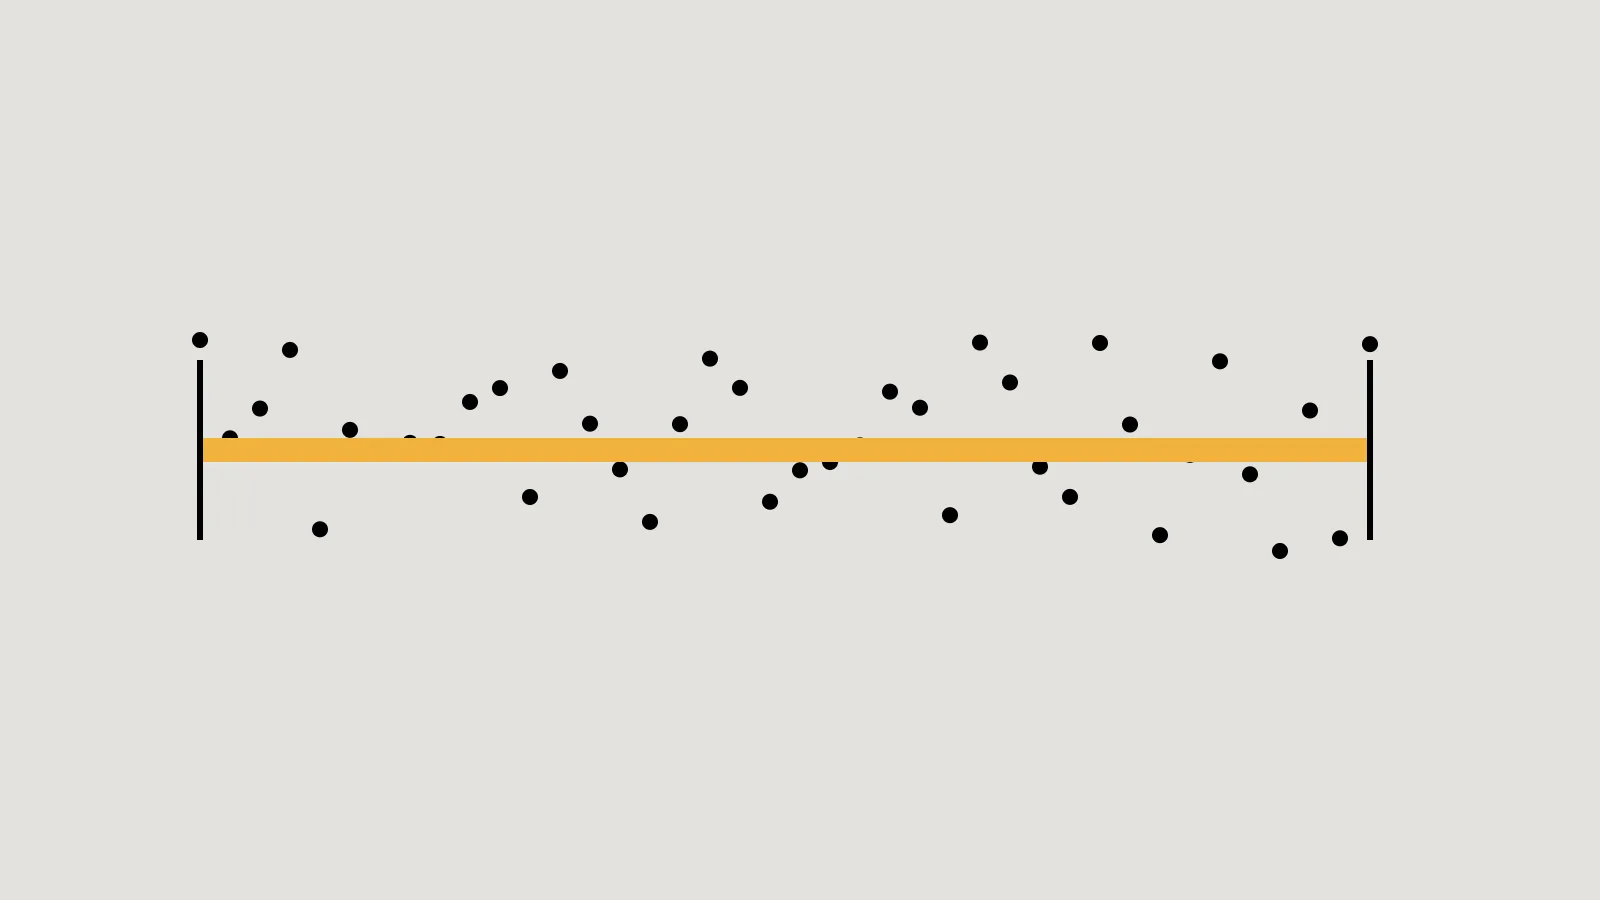
Say 60% of the customers who answered your survey would like evening appointments. How sure can you be that the true figure, across all your customers, is close to 60%? The margin of error is a way of answering that, for one specific kind of uncertainty.
What margin of error means
Pew Research Center explains it like this: a margin of error of plus or minus 3 percentage points at the 95% confidence level means that if the same survey were run 100 times, the result would be expected to fall within 3 points of the true population value 95 of those times. So “60%, plus or minus 5 points” means the true figure is probably between 55% and 65%.
Key takeaway
A result with a margin of error is a range, not a single number. Read it as a range.
How it shrinks with more responses
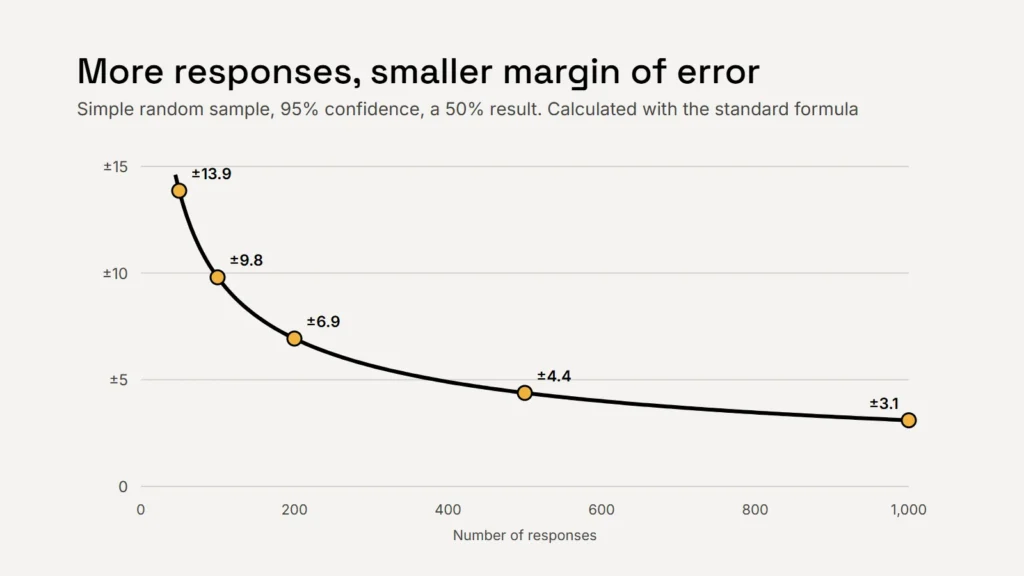
For a simple random sample, a common approximation for the margin of error at 95% confidence is 1.96 × √(p × (1 − p) ÷ n), where n is the number of responses and p is the result as a proportion. It’s largest when the result is 50%, so that is the cautious figure to plan with.
| Responses | Approximate margin of error |
|---|---|
| 50 | ± 13.9 points |
| 100 | ± 9.8 points |
| 200 | ± 6.9 points |
| 500 | ± 4.4 points |
| 1,000 | ± 3.1 points |
The pattern matters more than the exact numbers: going from 50 to 200 responses halves the margin, but you need four times as many responses to halve it again. For many small business decisions, a couple of hundred well-chosen responses is plenty. For a close call, it may not be.
Four times the responses buys you half the margin of error.
Subgroups are less precise
Pew notes that subgroups have fewer cases, so their margins of error are larger, sometimes much larger. If 400 customers answer but only 60 of them are new customers, any figure about new customers has the margin of a 60-response survey. Pew also points out that the margin for the difference between two results is generally about twice the margin for one.
What it can’t tell you
- Only chance is covered. Pew stresses that sampling variability is only one of many possible sources of error. Biased questions, missing groups of people and who chose to answer aren’t included in the margin.
- It needs a random sample. AAPOR, the US association of public opinion researchers, says probability sampling is what allows a margin of sampling error to be calculated, and that error margins should not be reported for non-probability samples.
- Most business surveys aren’t random. A link in a newsletter or on your website reaches whoever chooses to respond. The results can still be useful, but treat them as indications, not precise measures.
Key takeaway
If your survey was an open link, don’t quote a margin of error. Describe who answered instead.
So how many do you need?
- Start from the decision. If the answer would have to be very lopsided to change what you do, a smaller survey is fine.
- Plan for the subgroups you care about, not just the total.
- Invite a random selection of customers where you can, rather than relying on whoever sees a link, and follow up with people who don’t reply.
- Report honestly: the number of responses, how people were invited and the dates.
Good questions matter as much as numbers: see our guide to writing better survey questions. For the “why” behind the numbers, talk to people: our customer interviews field guide explains how.
Checklist
- Read results as ranges.
- A few hundred responses is often enough; four times more halves the margin.
- Subgroups and differences are less precise.
- No margin of error for open-link surveys.
- Report who answered and how.