“The market is huge” is not a plan. Whether you are a business deciding to sell into a new US state, or a service firm choosing which industries to focus on, the useful question is narrower: how many potential customers can we realistically reach here, and is that enough?
The US Census Bureau publishes a remarkable amount of free data that can answer it. This guide shows a method that works for most small-business decisions, whether your customers are businesses or households.
Start with a precise definition of the customer
Write one sentence describing who buys, for example: “independent dental practices with at least five employees in the Dallas–Fort Worth area”, or “homeowners aged 35–64 in three Ohio counties”. Every number that follows depends on this definition, so make it as specific as your offer really is.
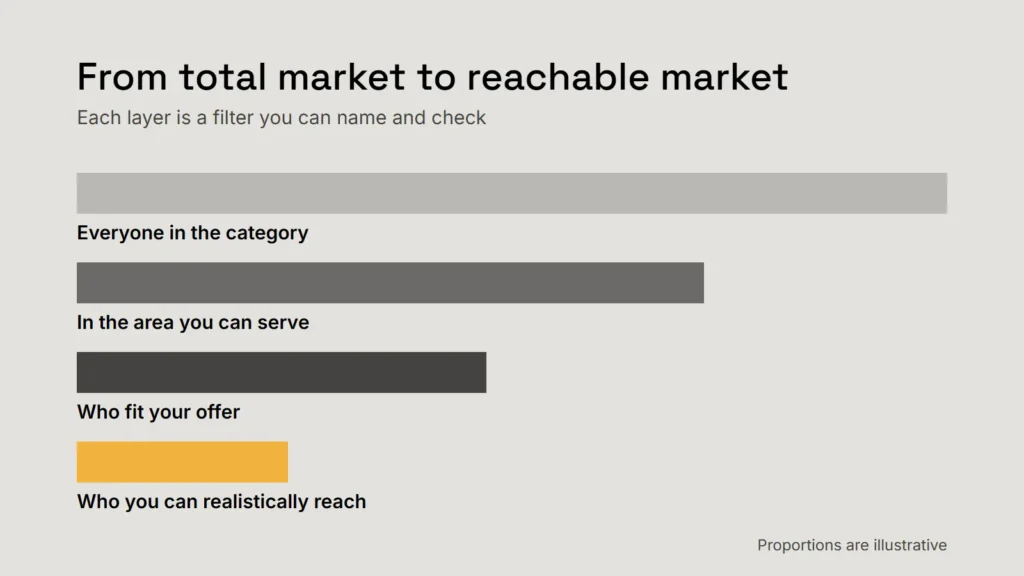
Then think in layers: everyone in the category, those in the area you can serve, those who fit your offer (size, budget, needs), and those you can realistically reach and win. Each layer should come from data or a stated assumption, never a guess presented as fact.
If your customers are businesses
1. Find the industry code
US business data is organised by the North American Industry Classification System (NAICS). Codes run from two digits (a broad sector) to six (a specific industry); dental offices, for instance, have their own six-digit code. Look up the closest codes on the Census Bureau’s NAICS pages, and note any neighbouring codes your customers might also fall under.
2. Count businesses with employees
County Business Patterns is an annual Census Bureau dataset of establishments with paid employees, by industry and by employment size, with employment and payroll. It reaches down to county level, and the latest edition covers 2023. Filter by your NAICS code, your geography and the size bands that fit your offer.
3. Add businesses without employees, if they matter
Many US businesses are owner-only. Nonemployer Statistics counts businesses with no paid employees, by industry, with their receipts; the latest data covers 2024. Include them if sole traders are genuine prospects for you, and leave them out if they aren’t.
Key takeaway
Count establishments, not just companies: a business with three locations appears three times, which is often what you want if each site buys separately.
If your customers are households
The American Community Survey (ACS) is the Census Bureau’s ongoing survey of people and households, covering topics such as income, age, education, occupation and whether people own or rent their homes. It comes in two main forms:
| 1-year estimates | 5-year estimates | |
|---|---|---|
| Based on | 12 months of data | 60 months of data |
| Available for | Areas of 65,000 people or more | All areas, down to small neighbourhoods |
| Strength | Most current | Most reliable |
| Use when | You need recent data for a large area | You need small areas or more precise figures |
ACS figures are estimates from a sample and come with a margin of error. Always look at it: for small areas or narrow groups, the margin can be large enough to change your conclusion.
Tools that make it easier
- data.census.gov is the main place to search and download Census Bureau tables.
- Census Business Builder packages selected demographic and economic data into simple maps and reports for a chosen business type and location, without needing to know table names.
From total market to a decision
Once you have the counts, apply the remaining layers explicitly and write each assumption down: the share that fits your offer, the share you could reach through your channels, and a realistic win rate. Use ranges rather than single numbers, and work out a low, middle and high case.
The output is not a forecast. It is a test: if even the high case can’t support the effort, the answer is no. If the low case already works, the decision is easy. Most real decisions sit in between, and the value of the exercise is knowing which assumption matters most, so that a few customer interviews or a small trial can check it.
Market sizing is less about the final number than about knowing which assumption it depends on.
Common mistakes
- Using a whole sector when only one industry within it is a real prospect.
- Mixing data years or geographies without noticing.
- Ignoring margins of error on small ACS areas.
- Treating every business or household in the category as a buyer.
- Presenting the result as more precise than the assumptions behind it.
Checklist
- Define the customer precisely.
- Find the NAICS code, then use County Business Patterns and Nonemployer Statistics.
- Use the ACS for households, and check margins of error.
- Apply written, ranged assumptions.
- Test the assumption that matters most.
Customer interviews are often the quickest way to test those assumptions; our field guide to customer interviews explains how to run them.
Related service
Market research and data analytics
Market sizing, customer research and analysis designed around a decision.
Sources
- US Census Bureau: County Business Patterns
- US Census Bureau: Nonemployer Statistics
- US Census Bureau: About the American Community Survey
- US Census Bureau: When to use 1-year or 5-year ACS estimates
- US Census Bureau: North American Industry Classification System
- US Census Bureau: Census Business Builder
- US Census Bureau: data.census.gov