Google Trends shows how search interest in a word or topic changes over time and between places. For a small business, that answers practical questions. When does demand for our service peak? Do customers say “AC repair” or “air conditioning repair”? Is interest in what we offer rising or fading?
What the numbers actually mean
The most important thing to understand is that Trends shows relative interest. Google’s FAQ explains that it uses a sample of searches and normalises the data: each point is divided by the total searches in that place and time range, then scaled from 0 to 100. Google advises using relative comparisons to gauge popularity.
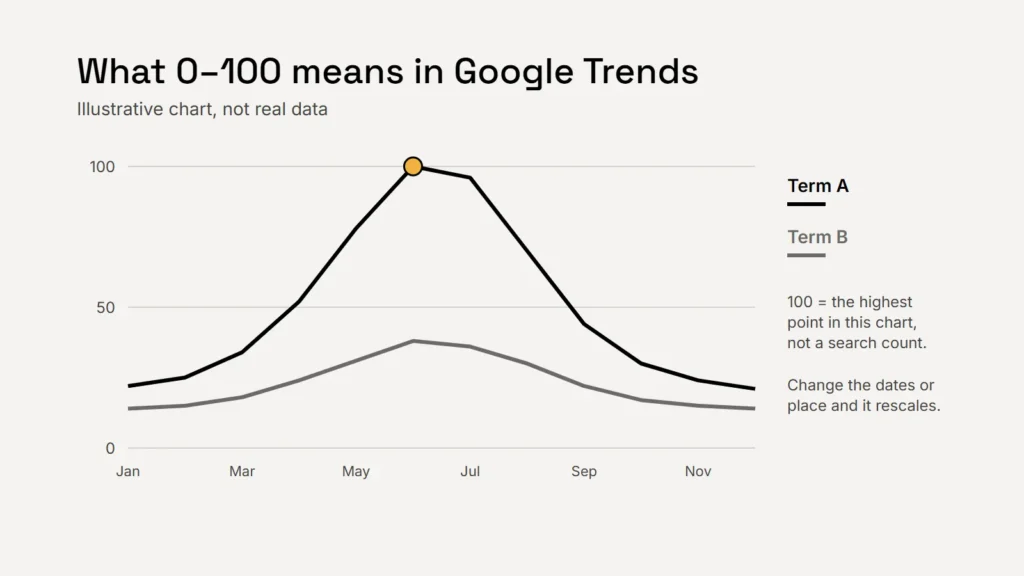
- 100 is the point of highest interest within the chart you’re looking at. It isn’t a fixed amount.
- Change the dates, place or terms and the scale changes, because it is recalculated for each view.
- Low-volume searches show as 0, so a small niche may look like no interest at all.
- Two regions with the same score don’t always have the same number of searches, as Google’s FAQ notes.
Key takeaway
Read Trends as shape and direction: when interest rises, falls and peaks. Don’t read it as volume.
Search terms or topics
Trends lets you compare either a search term or a topic. Google’s help explains that a term matches those words in your chosen language, while a topic is a group of terms that share the same concept in any language. Terms don’t include misspellings, synonyms or plural and singular versions. Use terms to compare exact wording, and topics for the overall subject.
Four useful questions to ask it
| Question | How to set it up |
|---|---|
| When is our busy season? | Your service as a term or topic, your state, the past five years. Look for the yearly pattern. |
| What do customers call it? | Compare two or three wordings, set to the US and the past 12 months. |
| Where is interest strongest? | Look at the breakdown by state or metro area, then compare the places you serve. |
| What else are people looking for? | Check related searches: “Top” shows the most frequent and “Rising” the fastest growing. |
Google’s help explains that a rising search marked “Breakout” grew by more than 5,000%. That often means it started from a very small base, so treat it as a hint to investigate, not proof of a big market.
Trends tells you when and where people care. It doesn’t tell you how many.
The limits to keep in mind
- It is a sample. Google adds a little statistical noise for privacy, which shows most on low-interest searches. One-off spikes in small terms may not be real search activity.
- It is not a survey. Google says Trends is not a scientific poll. It reflects searches, not opinions or purchases.
- It filters some searches, including repeated searches by the same person over a short time and queries with special characters.
When you need actual numbers
For estimated monthly search volumes, use a keyword tool. Google’s Keyword Planner, inside Google Ads, shows estimates of how many searches a keyword gets each month. Its help says you need to complete your account setup, including billing information, to use its basic features. Pair that with Census data on how many potential customers live in an area: our guide to sizing a US market with Census data shows how. For questions searches can’t answer, ask customers directly, as our customer interviews field guide explains.
Checklist
- Relative interest, scaled 0–100 for each view.
- Compare shapes, seasons and places, not volumes.
- Terms for exact wording; topics for subjects.
- Treat Breakout and small spikes with caution.
- Use Keyword Planner and Census data for numbers.
Related service
Market research and data analytics
Demand research that combines search, census and customer data.